
 by
by It will soon be back to school, it was hot, the beach was good and the sand very warm. You are therefore well rested and ready to go back to school. It is therefore the right time to review some statistical bases that will allow you to better understand and use Machine Learning algorithms. Don’t make a face, it’s for a good cause.
In this article, I suggest that you review the essential background of any good Data-Scientist:
- Average
- Median
- Standard deviation
- Variance
- Quantile
- Quartile
Index
The average
Do you all know what the mean is? yes undoubtedly, nevertheless we are going to redefine it all the same, above all to put it in perspective with the notion of median that we will see later.
The average is therefore defined by the sum of the data divided by the number of data. Or from a mathematical point of view:
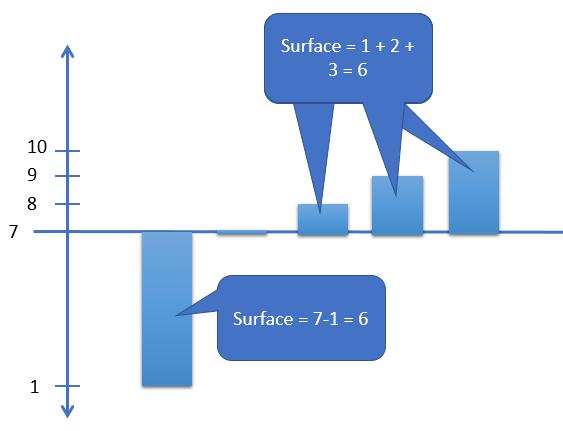
Let’s take an example now with a small distribution of values = [1, 7, 8, 9, 10], the mean is obviously 7.
Seen in a graphical perspective let’s bring the y-axis back to the average value to better visualize it. Well, it’s as if the area of the values above and below this average were equal.
The median
Beware of the confusion! because median does not mean at all mean (even if these two values can be equal. By definition the median is the value of a distribution which makes it possible to cut this same distribution into two equal parts.
If we take our previous distribution, we will have the median value of 8:
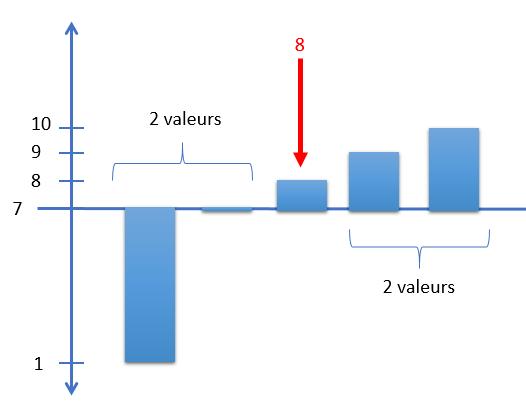
In fact the calculation is rather obvious as soon as we have an odd number of values in our distribution.
On the other hand, if we have a number of values that is even, the median is the average of the two values in the middle.
Standard deviation
The standard deviation ( standard deviation in English), also spelled standard deviation is a mathematical concept defined in probability and applied to the statistics . In probability , the standard deviation is a measure of the dispersion of a random variable ; in statistics , it is a measure of data dispersion. It is defined as the square root of the variance or, equivalently, as the root mean square of the deviations from the mean . It has the same dimension as the random variable or statistical variable in question.
Standard deviations are encountered in all fields where probabilities and statistics are applied, in particular in the field of surveys , physics , biology or finance . They generally make it possible to synthesize the numerical results of a repeated experiment. Both in probability and in statistics, it is used to express other important concepts such as the correlation coefficient , the coefficient of variation or the optimal Neyman distribution .
The standard deviation is used to measure the dispersion of a data set around the mean. The lower it is, the more the values are grouped around the mean.
Example of two samples with the same mean but different standard deviations illustrating the standard deviation as a measure of the dispersion around the mean:

(Source Wikipedia)
The standard deviation is therefore a measure that measures the dispersion of data in a distribution.
This measurement consists in calculating the distance of the points in relation to the mean.
To better understand this measurement, see how it is calculated from a practical point of view in 5 simple steps:
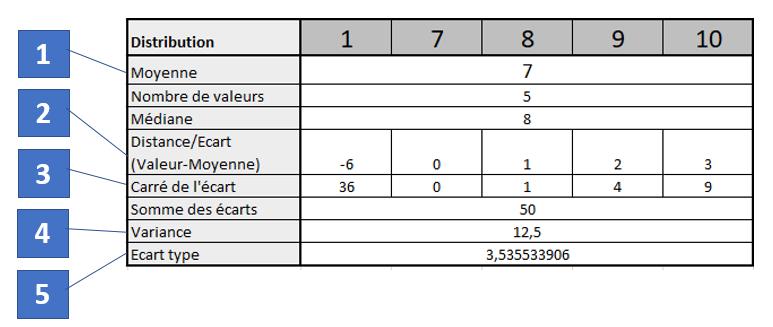
Steps :
- Calculation of the mean of the distribution (here the mean is equal to 7).
- Calculate the distance between the mean and each value of the distribution (a simple subtraction)
- Squaring the previously calculated distance
- Variance calculation: It is the sum of the squared deviations calculated previously divided by the number of values in the distribution minus 1.
- Calculation of the standard deviation: it is simply the square root of the variance.
From an analytical point of view here is the calculation formula:
Variance
We just saw the variance is simply the square of the standard deviation.
Quantile
We have seen that the median allows a distribution to be split into two equal parts. Well, quantiles are only a generalization of this idea of breaking up a distribution into shares. The underlying idea is therefore to create cuts with a number of equal values in this distribution.

From a vocabulary point of view:
- The median separates the values into two equal population groups.
- The quartiles divide them into four groups.
- and from a global point of view: the quantiles in n.
NB: there are also the percentiles and deciles.
Quartile
The quartiles are the three quantiles that divide a data set into four equal-sized groups. The median is the quantile that separates the dataset into two groups of equal size.
From a practical point of view (Q1 = 1st quartile, Q3 = 3rd quartile):
- A quarter of the values are less than or equal to Q1.
- Three quarters of the values are less than or equal to Q3.
- Half of the values lie in the interquartile range [Q1; Q3].


One thought on “Minimum statistics knowledge needed for Machine Learning”