
 by
by Index
A new arrival in the world of profiling
In 2016 Pandas Profiling made its appearance, and with this library opened the world of data preparation in the Python universe (oh so essential phase of a Data science project). I had also devoted an article on the subject here.
2020 will undoubtedly be the year of “dataprep” and more particularly of dataprep.eda! indeed the dataprep project is broken down into several sub-projects (including that of eda: Exploratory Data Analysis, and dataprep.data_connector) … but others are in progress and given the name of the library we can easily s ‘imagine what they will cover.
In short, let’s see what this bookstore has in the belly …
Installation of dataprep.eda
Like any Python library, it all starts with installation and deployment. For this nothing is more efficient than using the pip command:
pip install dataprep
For more information on the library, go to https://sfu-db.github.io/dataprep/ you will also find (in English) user documents, etc.
If you want to use conda or even mamba type the following commands:
conda install -c conda-forge mamba
ou
mamba install -c conda-forge -c sfu-db dataprep
The dataprep library is really very simple and has 4 main functions that we will see later:
Distribution analysis
As often, we will use the titanic data to look at the distribution of this data set in a single line:
import pandas as pd
from dataprep.eda import *
from pandas_profiling import ProfileReport
data = pd.read_csv("../datasources/titanic/train.csv")
plot(data)
A simple call to the plot () function on a Pandas daraframe is enough to display the following graphs:
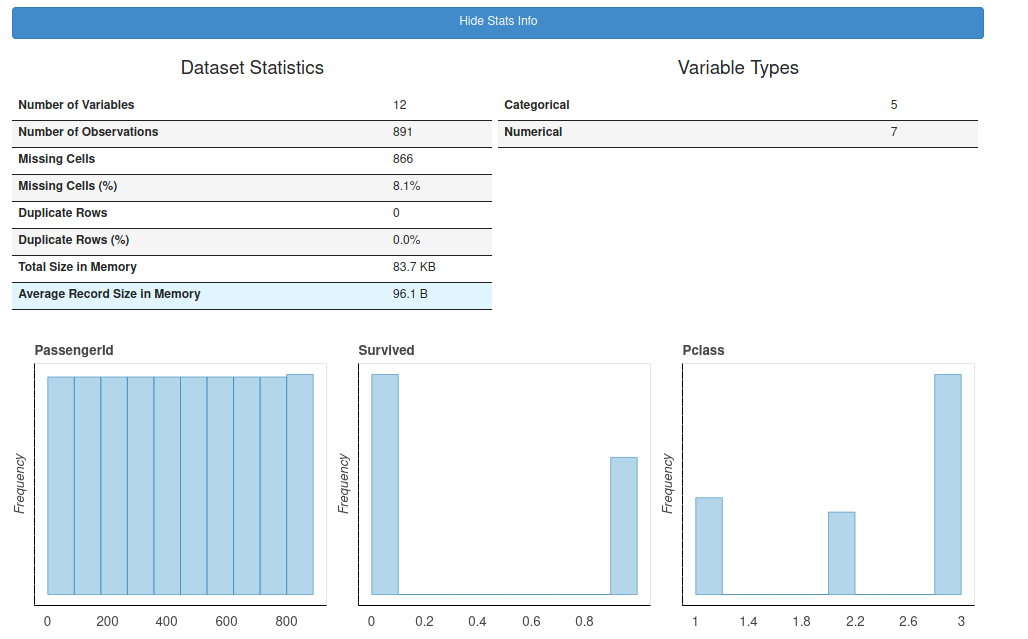
Each column presents a distribution graph (a bar of course). Clicking on the “Show Stats Info” header provides general information (Number of missing data, duplicates, etc.).
You don’t necessarily want to have all the columns? no problem, you just need to specify the desired column (s) to the plot () function as follows.
Single column details
plot(data, "Age")
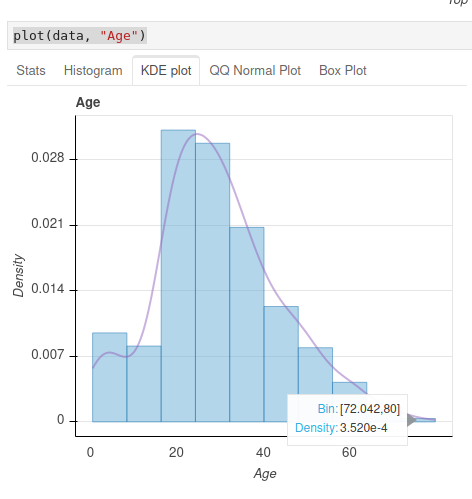
In this detail visualization you will even have access to additional viz to help you in your analysis. A certain number of tabs (Stats, Histogram, etc.) allow you to visualize at a glance – almost – all the information of the desired column.
Confront 2 columns
It is also often convenient to look at two columns between them, once again the plot () function allows us to do this very easily. Below we will display in the same viz the age and price data of the ticket:
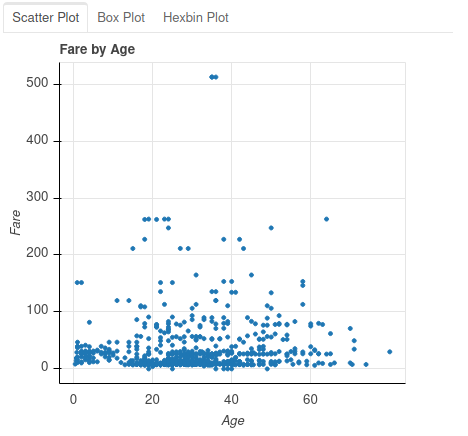
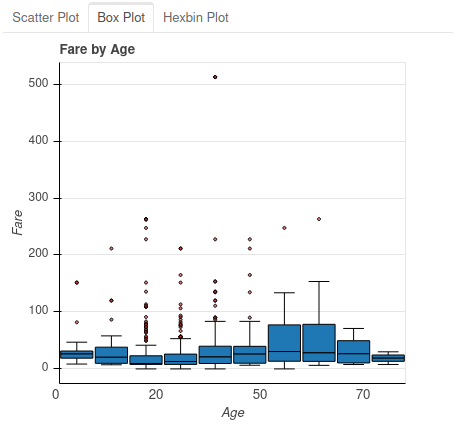
plot(data, "Age", "Fare")
Once again several tabs are proposed in order to present the data either for example under a point graph (scatter plot) or box and whisker plot (box plot) or under a hexagonal point graph (hexagonal binning plot ):
Missing Values Analysis
An important aspect – especially for machine learning projects – is the analysis of missing data. dataprep.eda offers the plot_correlation () function
plot_missing(data)
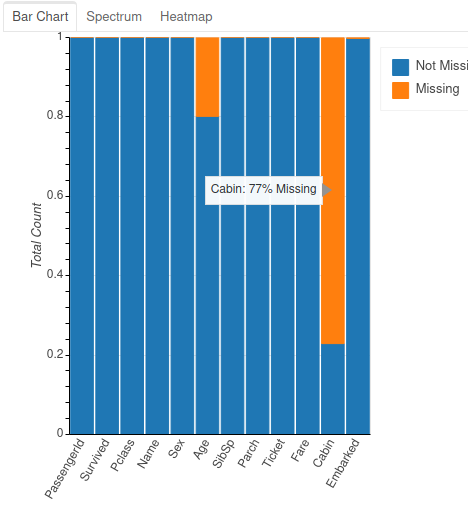
As before, several tabs are available to present different ways of viewing this information (heat map, bars, etc.). Note that if you have categorical data the graphs will be different… try it!
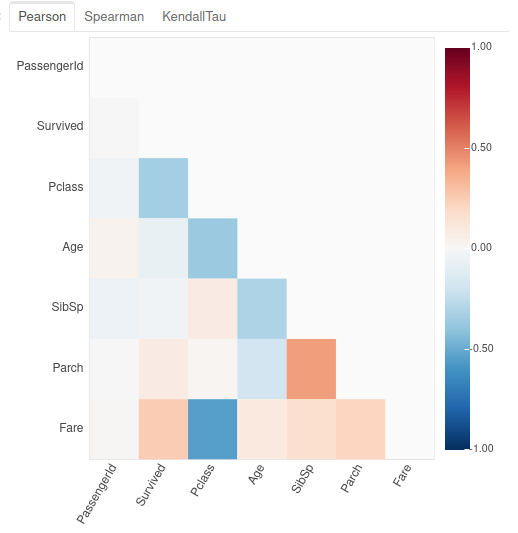
Correlation analysis
Another very interesting aspect is the correlation analysis which allows you to discover the degree of connection between the columns of the dataset. We saw this notion in a previous article so I won’t go over the different calculation methods .
With datapre.eda, we don’t ask ourselves any questions and we use the plot_correlation () function
plot_correlation(data)
Report creation with create_report ()
Report generation is started using the command
ProfileReport(data).to_widgets()
Conclusion
This bookstore, as I said in the introduction, is recent (2020) and already very promising. After a few tests we can already say that compared to Pandas Profiling we find these advantages:
- Clearly a better design of APIs
- According to some benchmarks – and especially via the promises of the designers – this library is up to 100 times faster! to check anyway.
- Intelligent and adaptive visualization (admittedly much less static)
- Allows the handling of much larger data (which was clearly a limitation of Pandas Profiling).