Index
Kaggle Competition: “New York City Taxi Fare Prediction”
Recently, when I launched into the Kaggle competition on the prediction of the amount of New York taxi fare, I encountered the processing of location data. For precisely I had to process Geo-Localized data (Latitude-Longitude). To be honest, in this Kaggle competition we have almost nothing else than that! Basically we get the contact details of the client (s) and those of the place where the taxi dropped them off, and that’s almost it!

As I said, we have very little data, so we will have to make the most of this information for, for example:
- Determine the distance between the collection-drop points
- Determine the travel time (because of course this has an impact on the amount of the race)
- Remove outliers. If you look closely on a map you will certainly see that some points are out of bounds, or even in the water! this unusable data will have to be deleted.
- Detecting the proximity of an airport … indeed, trips to this type of destination are often fixed.
- etc.
For this it is necessary to be able to exploit the geolocation data.
Check that the data is in a frame
In the example of taxis, it is rather simple because we must restrict the geolocated data to the New York area. The other data will be considered as outliers (errors or exceptions) that we will simply remove from the dataset. These data are not significant for our model.
To do this, let’s simply get the coordinates of New York on the internet …
We therefore recover the following information:
The coordinates of New York in decimal degrees:Latitude: 40.7142700 °
Longitude: -74.0059700 °
The coordinates of New York in degrees and decimal minutes:Latitude: 40 ° 42.8562 ′ N
Longitude: 74 ° 0.3582 ′ W
We will now define a framework of belonging to New York (obviously we will be approximate here, the city of NYC not being located in a perfect framework): (-74.3, -73.7, 40.5, 40.9)
Then we define a simple function (Python) BelongFrame () which checks that the input coordinates are indeed in the desired frame:
nycBox = (-74.3, -73.7, 40.5, 40.9)

# Cette fonction vérifie que les coordonnées passées (df) sont bien dans le cadre BB
def AppartientCadre(df, _nycBox):
    return (df.pickup_longitude <= _nycBox[0]) & \
 (df.pickup_longitude <= _nycBox[1]) & \
(df.pickup_latitude <= _nycBox[2]) & \
(df.pickup_latitude <= _nycBox[3]) & \
(df.dropoff_longitude <= _nycBox[0]) & \
(df.dropoff_longitude <= _nycBox[1]) & \
(df.dropoff_latitude <= _nycBox[2]) & \
(df.dropoff_latitude <= _nycBox[3])
pd_sample = pd_sample[AppartientCadre(pd_sample, nycBox)]
Display on a map
Here we have removed some outliers, but it would be interesting to see a bit what our data looks like, don’t you think? for that I suggest you visualize them on a map. For this we still have the possibility of using Google Maps by creating a map with the points that we have. Some sites even offer this service by importing a file for example. However, we are not going to proceed like this because we really have a lot to visualize.
We are going to superimpose our points on an image (map). Our only prerequisite is to have a map (image) and especially to know its GPS coordinates.
For our example we get the map via https://aiblog.nl/download/nyc_-74.3_-73.7_40.5_40.9.png
Its coordinates are ( – 74.3 , – 73.7 , 40.5 , 40.9 ) … no it’s not a coincidence, it is indeed the previous coordinate validation framework
We are now going to plot our points on this image with the matplotlib library (scatterplot):
import matplotlib.pyplot as plt
nyc = plt.imread('https://aiblog.nl/download/nyc_-74.3_-73.7_40.5_40.9.png')
def plotOnImage(df, _nycBox, nyc_map):
    fig, a = plt.subplots(ncols=1, figsize=(10, 10))
    a.set_title("Points sur NYC")
    a.set_xlim((_nycBox[0], _nycBox[1]))
    a.set_ylim((_nycBox[2], _nycBox[3]))
    a.scatter(df.pickup_longitude, df.pickup_latitude, zorder=1, alpha=0.3, c='r', s=1)
    a.imshow(nyc, zorder=0, extent=_nycBox)
plotOnImage(pd_sample, BB, nyc_map)
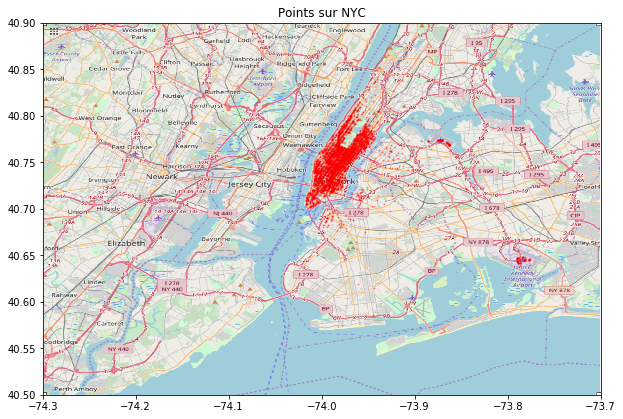
Look at the result:

The points are drawn in red. We observe the concentration of the latter in the city center as one would have expected!
Calculate distance
The distance is of course an important data to recover. For this we can still have several approaches. You can calculate the distance between two points using the Haversine formula or use the Google Maps APIs. We will see these two approaches.
Calculation using Haversine’s formula
Here is the mathematical formula :

So obviously this formula can seem very complex. But that would be forgetting that we are on earth and that this good old earth is spherical! it is therefore unthinkable (except for very short distances) not to take into consideration the spherical shape of the earth. Hence this formula …
In Python, this is what it looks like:
def distance(lat1, lon1, lat2, lon2):
    p = 0.017453292519943295 # Pi/180
    a = 0.5 - np.cos((lat2 - lat1) * p)/2 + np.cos(lat1 * p) * np.cos(lat2 * p) * (1 - np.cos((lon2 - lon1) * p)) / 2
    return 0.6213712 * 12742 * np.arcsin(np.sqrt(a))

distance(pd_sample.pickup_latitude[0],
         pd_sample.pickup_longitude[0],
         pd_sample.dropoff_latitude[0],
         pd_sample.dropoff_longitude[0])
Calculation via Google maps
There it gets a bit trickier because to use the Google API you must:
- Have a Google account (gmail)
- Declare the use of the API in order to obtain a key. To do this go to the URL https://console.developers.google.com and add the Maps Distance API
- import the googlemaps library ( https://github.com/googlemaps/google-maps-services-python ) via
pip install googlemaps
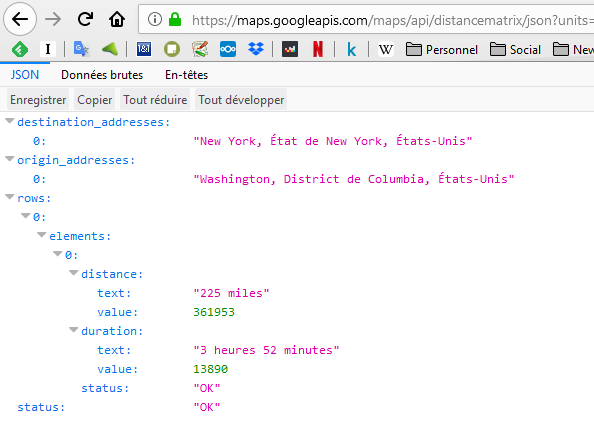
To test I invite you to check that the API is active by typing in your browser directly:
https://maps.googleapis.com/maps/api/distancematrix/json?units=imperial&origins=Washington,DC&destinations=New+York+City,NY&key=(YOUR KEY HERE]
NB: replace [YOUR KEY HERE] with the key you got from the Google site .
You must have this screen:

Now you can make a call via Python API:
pd_sample['pickup'] = pd_train.pickup_latitude[0].astype(str)+","+pd_train.pickup_longitude[0].astype(str)
pd_sample['dropoff'] = pd_train.dropoff_latitude[0].astype(str)+","+pd_train.dropoff_longitude[0].astype(str)
print ("Pickup:" + pd_sample['pickup'][0])
print ("Dropoff:" + pd_sample['dropoff'][0])

import googlemaps
gmaps = googlemaps.Client(key="[VOTRE CLE ICI]")
def distance_googlemaps(pickup, dropoff):
    geocode_result = gmaps.distance_matrix(pickup, dropoff)
    try:
        distance = float(geocode_result['rows'][0]['elements'][0]['distance']['text'].split()[0])
        duration = geocode_result['rows'][0]['elements'][0]['duration']['text'].split()
        if len(duration)==4:
            mins = float(duration[0])*60 + float(duration[2])
        else:
            mins = float(duration[0])
    except:
        mins = np.nan
        distance = np.nan
    return pd.Series((distance, mins))
distance_googlemaps(pd_sample['pickup'][0], pd_sample['dropoff'][0])
You noticed Google even offers us the travel time between the two points.
Here we have seen how to retrieve, visualize and enrich geolocation data. We have scratched the surface of the Google API but if you take a closer look you will find lots of other useful functions as well as some interesting settings to adjust.


