
 by
by Index
Introduction
As soon as you start to design machine learning models, you will have to face the delicate problem of balance in the adjustment of bias and variance . Finding that famous balance is the main ingredient of a good model.
Unfortunately, there is no magic recipe. Knowledge, experience and even intuition will help you in this difficult – but oh so exciting – task! That said, I will not focus on the methods of adjusting these two essential indicators in this article but rather on their meaning.
So … compromise or dilemma between these two essential indicators? first of all, what it is about exactly ?
What is bias?
Bias is measuring the error. When we create Machine Learning Models we are not looking for a rule that will answer 100% exactly to a given problem. In any case, finding such a rule is illusory because the data that feeds the models are not completely exact either.
In brief, learning from experience is therefore done by the gradual adjustment of a (supervised) model. And the fit of this model is itself achieved by minimizing the error between what the model can produce relative to the real and seen value.
To illustrate my point, I like to use the image of a target in archery:
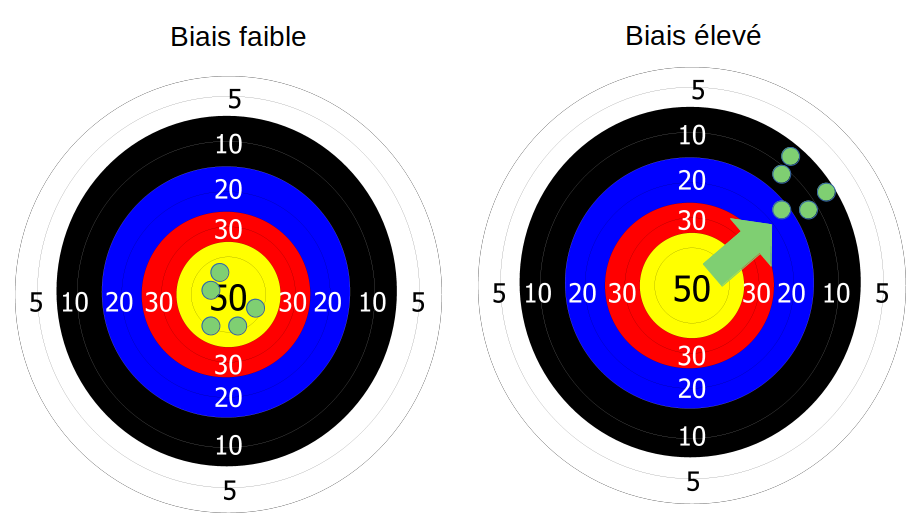
Just suppose you are shooting with your bow) an arrow and there is a fair amount of wind. However, you are safe (under a roof) and you have not felt this wind. So, you make your shots, and surprise, they are all staggered like in the image above to the right.
Well, this wind parameter that you did not take into account during your shots is your bias. And this bias causes an annoying shift in your result.
Okay, but what about the bias in machine learning?
In the world of Machine Learning, we are constantly calculating and comparing errors (how to do a gradient descent otherwise?), We are above all always looking to minimize it as much as possible (even if it is sometimes not the right thing to do? as we will see below).
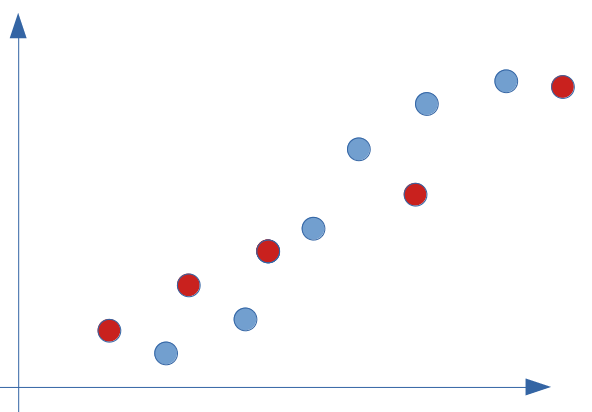
Let us take a simple example of distribution on a few points only as below:
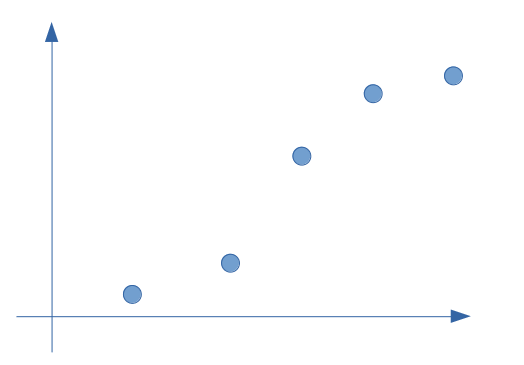
At first glance, a linear regression partially responds to this type of problem. Let us look at the straight line in this hypothesis and calculate its error with respect to reality (the real value observed in our supervised modeling):
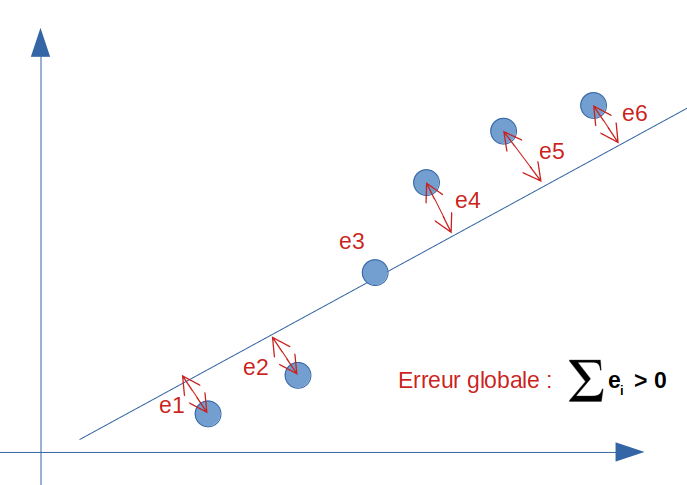
The global error (or the bias) is of course not zero because the line cannot pass through all the points at the same time. We therefore have a more or less high bias on this model. Let’s say we would have a score of 95% .
What if now we get zealous and find the perfect model for this breakdown? look at the result below, the error and therefore the bias is zero:
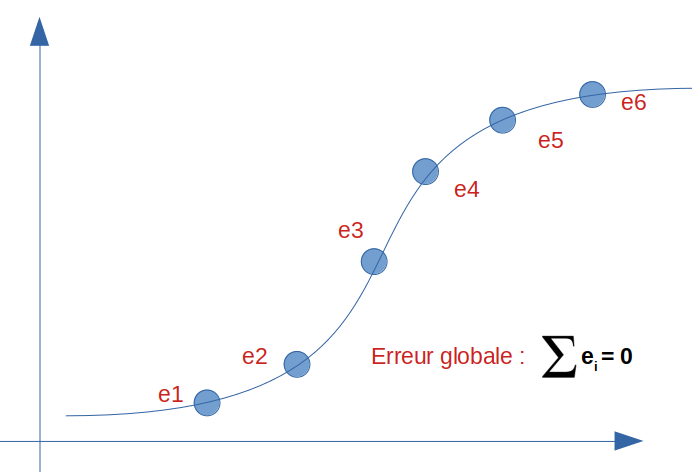
So we have a 100% score. It’s really great, isn’t it? So mission accomplished? on the side of the bias yes… but did we not go too far? we will now see the side of another important indicator: the variance if our model is that good.
The variance
The variance is measuring the dispersion of a list of values. If we take our previous image of archery. We have now taken into account the wind but on the other hand we forgot our glasses (admittedly it’s not really practical especially when you are short-sighted to go archery). Seeing as blurry, there’s a good chance our result looks like this:
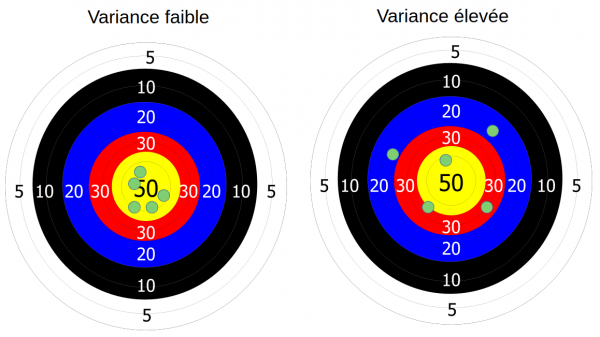
The arrows are scattered around the center (in statistics, the variance is referred to as scattering around the mean).
What about variance in machine learning?
We saw in our previous example that we minimized the bias as much as possible (to zero). Be careful though because we made this model on a training dataset … let’s see what this model would look like with the test dataset (red dots):
If we apply the previous model whose score was, I remind you, 100%, and we calculate the error, we especially notice that the bias is far from zero:

It is even very likely that the score is now quite catastrophic because the error is undoubtedly greater than that of our good old line (linear regression):
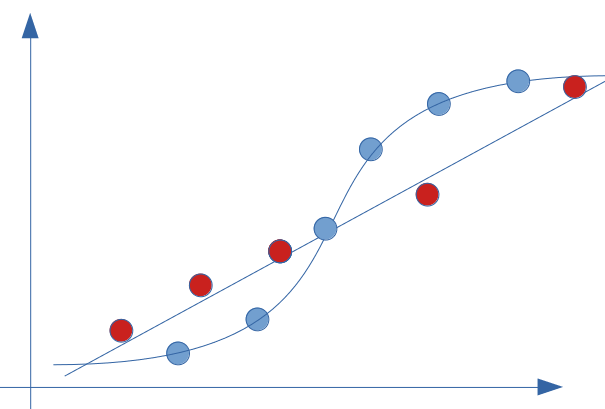
In fact, here is the illustration of what over-training (overfit) is, the plague of Data Scientists.
Conclusion
If the bias calculates the error of a model, the variance makes it possible to calculate its resilience, that is to say its capacity to generalize. The challenge is therefore to find a good compromise between an acceptable error and a good capacity for generalization… because indeed perfection is not possible for both as we have just seen. There is therefore no question of dilemma (or choice) insofar as these two indicators must be adjusted together to have a good model!
The only thing that’s not really practical is that you can’t adjust these two parameters simultaneously. You must first design the model (without being too greedy as a result), then test it on other datasets. It therefore takes time, and patience … another virtue of the data scientist 😉