
 by
by After working with Kaggle data from the Titanic in my previous articles ( part 1 and part 2 ), I naturally wondered if we could get better results using Deep Learning techniques. At first glance and in view of the data (structured type) and especially the size of the datasets, I would say that it will be difficult to do better than with traditional approaches.
Of course I am not the first to try the experiment and you will also find on the Kaggle site some well-made notebooks which tackle this data using Deep learning techniques. Here is one that is very well done for example: https://www.kaggle.com/jamesleslie/titanic-neural-network-for-beginners
Index
Keras
For this experiment, I will therefore use the Keras framework with Python which makes it possible to approach this type of technique with ease. For those who do not know this framework, Keras is a high level Deep learning API (neural networks). It is a framework written in Python which is interfaceable with lower level APIs like TensorFlow , CNTK and Theano.
By default Keras uses Tensorflow (Google API). This means that we must also install this API, otherwise Keras will not work!
Installing Tensorflow
Obviously I recommend you to consult the documentation of Tensorflow here .
In any case, the installation is rather simple and is carried out via pip:
# Current stable release for CPU-only
pip install tensorflow
Once Tensorflow is installed, we can switch to keras.
Installation of Keras
Installing keras is hardly more complex with pip:
pip install keras
Let’s prepare our data first
We will keep it simple for this first try, and we only recover 6 data / variables:
train = pd.read_csv("../../datasources/titanic/train.csv")
X = train.drop(['Survived', 'Name', 'Sex', 'Ticket', 'Cabin', 'Embarked' ], axis=1)
X['Pclass'] = X['Pclass'].fillna(5)
X['Age'] = X['Age'].fillna(X['Age'].mean())
X['Fare'] = X['Fare'].fillna(X['Fare'].mean())
y = train['Survived']
X.head()
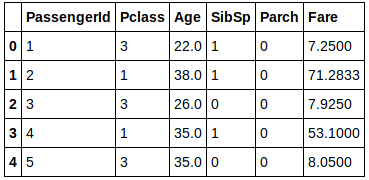
Of course we can only process non-zero digital data.
Our first deep learning model
The basic data structure with Keras is the model. A model is actually a way of organizing the layers (a fundamental concept in deep learning) of your neural network. Keras is actually going to make our lives easier in managing these layers of neurons. The simplest type of model that we will come across is the sequential model. This is of course the one we will be using here and it is made up of a linear stack of layers.
First, let’s declare the Python modules we will need (our famous model and the layers):
from keras.models import Sequential
from keras.layers import Dense
import pandas as pd
Next, let’s create our neural network (sequential model) made up of 3 layers:
model = Sequential()
model.add(Dense(units=6, activation='relu', input_dim=6))
model.add(Dense(activation="relu", units=100, kernel_initializer="uniform"))
model.add(Dense(activation="sigmoid", units=1, kernel_initializer="uniform"))
See how ketas can be used simply: We simply stack the layers with the add () method. The number of neurons is determined by the units parameter.
So, the first layer is the input layer it allows the mapping with the input variables (here we will have 6 variables). The second layer is a layer of 100 neurons. the third is the output layer which makes it possible to make the “decision”, we will use the “sigmoid” function in this case but we can change it as needed.
This is what our neural network looks like:
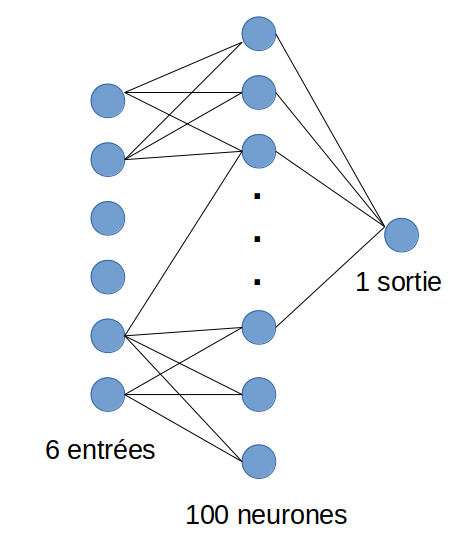
NB: I did not intentionally draw all the inter-neuron links, but be aware that they are all connected to each other between each layer.
keras provides us with a function that allows us to check the established model:
model.summary()
_________________________________________________________________
Layer (type)                 Output Shape              Param #
=================================================================
dense_20 (Dense)             (None, 6)                 42
_________________________________________________________________
dense_21 (Dense)             (None, 100)               700
_________________________________________________________________
dense_22 (Dense)             (None, 1)                 101
=================================================================
Total params: 843
Trainable params: 843
Non-trainable params: 0
Now let’s train our model via the fit () function
model.fit(X, y, epochs=50, batch_size=30)
At this point keras begins to become very talkative. It actually explains the detail of what happens when it goes through Tensorflow to calculate all the weights of all the neurons (see Backpropagation technique ). But we will come back to this in a future article. For now, let’s wait for this processing (which can be very long) to end… with the little data we have, we shouldn’t wait long.
Epoch 1/50
891/891 [==============================] - 0s 470us/step - loss: 0.7276 - acc: 0.5432
Epoch 2/50
891/891 [==============================] - 0s 36us/step - loss: 0.6632 - acc: 0.6184
Epoch 3/50
891/891 [==============================] - 0s 35us/step - loss: 0.6437 - acc: 0.6162
Epoch 4/50
891/891 [==============================] - 0s 33us/step - loss: 0.6302 - acc: 0.6420
Epoch 5/50
891/891 [==============================] - 0s 33us/step - loss: 0.6374 - acc: 0.6498
Epoch 6/50
891/891 [==============================] - 0s 37us/step - loss: 0.6156 - acc: 0.6790
Epoch 7/50
891/891 [==============================] - 0s 32us/step - loss: 0.6128 - acc: 0.6734
Epoch 8/50
891/891 [==============================] - 0s 32us/step - loss: 0.6548 - acc: 0.6431
Epoch 9/50
891/891 [==============================] - 0s 31us/step - loss: 0.6658 - acc: 0.6431
Epoch 10/50
891/891 [==============================] - 0s 32us/step - loss: 0.6375 - acc: 0.6667
Epoch 11/50
891/891 [==============================] - 0s 29us/step - loss: 0.6033 - acc: 0.6857
Epoch 12/50
....
Now let’s look at our scoring:
scores = model.evaluate(X, y)
print("\n%s: %.2f%%" % (model.metrics_names[1], scores[1]*100))
891/891 [==============================] - 0s 168us/step

acc: 69.58%
Not so great is it?
Finalize
Now we need to apply our model to our test data in order to submit it to Kaggle:
test = pd.read_csv("../datasources/titanic/test.csv")
Xt = test.drop(['Name', 'Sex', 'Ticket', 'Cabin', 'Embarked' ], axis=1)
Xt['Pclass'] = Xt['Pclass'].fillna(5)
Xt['Age'] = Xt['Age'].fillna(Xt['Age'].mean())
Xt['Fare'] = Xt['Fare'].fillna(Xt['Fare'].mean())
Then we will run our prediction on this model:
predictions = model.predict(Xt)
You have noticed ? the data are decimal data ranging from 0 to 1, we will have to determine a decision threshold to have a binary result then write our result in a file:
print([1 if x >= 0.5 else 0 for x in predictions])
final = pd.DataFrame()
final['PassengerId'] = test['PassengerId']
final['Survived'] = [1 if x >= 0.5 else 0 for x in predictions]
final.head()
All you have to do is submit this result to Kaggle. But to be honest, we got a much less interesting result than with a more traditional Machine Learning approach as one might expect. Of course we are only dealing with 6 variables, and with very few layers. Here is what will give rise to a future article to see how we can optimize our neural network.
As usual you will find all the code on Github .


One thought on “Keras to the rescue of the Titanic?”