
 by
by Spliting or just preparing the datasets in a Machine Learning project is a very important step that should not be neglected, otherwise you risk over evaluating your model (over-fitting) or quite simply the opposite (under fitting). Indeed by nature a model will stick (but not too much) to its training data.
This step is therefore a preliminary step but also an optimization step that should not be overlooked. We will see in this article how to manage your datasets with Python and Orange.
Index
Training data vs. test data
As we have seen in the process of a Machine Learning project, it is essential to have two minimum data sets: one for training the model and the other for its validation. But very often you recover data in bulk!
Never mind, just cut your data set in two (say 30% for the test data that we put aside and the rest for training)!
Complete Dataset can be divided into 2 parts:
- 70% training data
- 30% test data
But in this case, how do you break down your data while maintaining a certain consistency and above all representativeness? Difficult, if not impossible in fact, especially when your dataset reaches a large amount. We will see how to overcome this problem through several techniques.
Split your data
Python Scikit-Learn offers a very practical function for splitting datasets: train_test_split . Here we are asking for a 33% dataset breakdown for test data and the rest for training:
import pandas as pd
from sklearn.model_selection import train_test_split
train = pd.read_csv("../datasources/titanic/train.csv")
X = train.drop(['Survived', 'Name', 'Sex', 'Ticket', 'Cabin', 'Embarked' ], axis=1)
X['Pclass'] = X['Pclass'].fillna(5)
X['Age'] = X['Age'].fillna(X['Age'].mean())
X['Fare'] = X['Fare'].fillna(X['Fare'].mean())
y = train['Survived']
X_train, X_test, y_train, y_test = train_test_split(X, y, test_size=0.33, random_state=42)
print ("Train=" + str(X_train.shape) + ", Test=" + str(X_test.shape))
Train=(596, 6), Test=(295, 6)The train_test_split function returns our data sets (Observation = X, result = y) divided into training and test sets. by adjusting the random_state and shuffle parameters one can even adjust the degree of (random) choice of distribution in one or the other dataset.
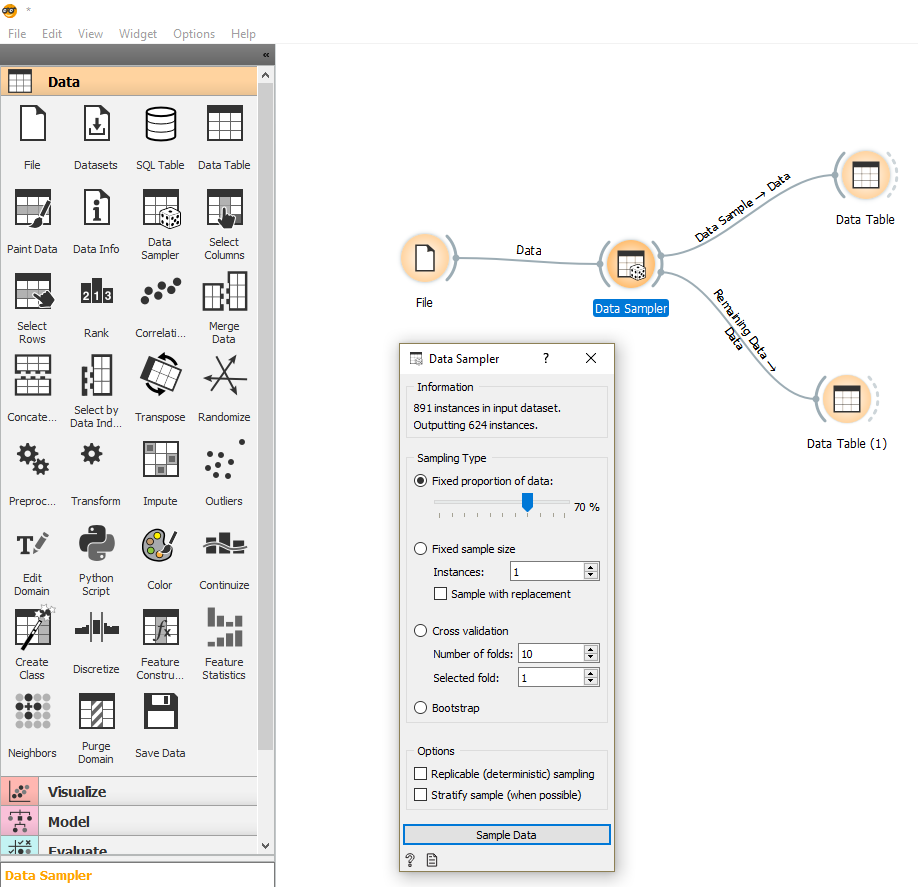
If you use Orange (free and open-source Data-Science tool), you will only have to use the Data Sampler widget:
Cut/split again
If this first division is essential or even vital, it is unfortunately not always enough. In order to optimize the adjustment of its model, during the training phase, we will cut out the training set again to make sure that we do not stick too much to the data used.
To optimize the training and check the consistency of the model, we will split our training datasets several times and train it each time (via iteration) on a part. We will then be able to see if the scoring is coherent on all the divisions carried out:
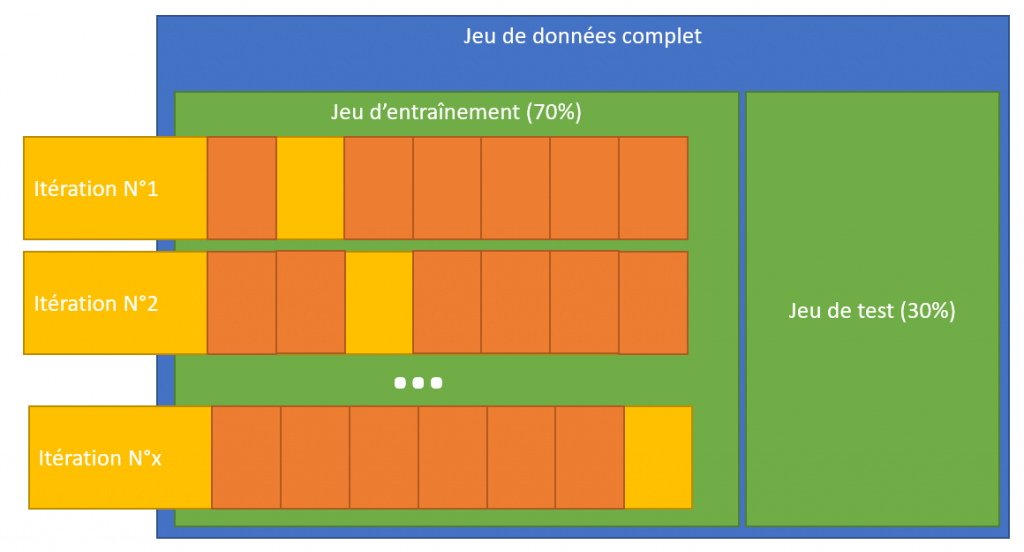
We can directly perform this cross-validation with the algorithm (using the hyperparameter cv). In the case below we cut in two steps:
clf = svm.SVC(kernel='linear', C=1)
score = cross_val_score(clf,X, y, cv=2)
array([0.66591928, 0.73033708])You can also use the KFold object from sklearn. In the example below we carry out a division in 4:
kf = KFold(n_splits=4, random_state=None, shuffle=False)
kf.split(X)
for train_index, test_index in kf.split(X):
    print("TRAIN:", train_index.shape, "TEST:", test_index.shape , str("\n"))
    print("TRAIN:", train_index, "\n\nTEST:", test_index , str("\n"))
It is then enough to pass the division carried out to the algorithm to see the result:
score = cross_val_score(clf,X, y, cv=kf)
array([0.6367713 , 0.68609865, 0.71748879, 0.72522523])As usual, find the sources for this article on Github .