For the “Kaggle killer” 75% at the Titanic is not terrible. Certainly ! However, for those new to Machine Learning and wanting to get their head out of theory using a practical case, this kaggle competition is perfectly suited. In short, the idea of this article is to show you through this practical case how to get started in a kaggle competition. You’ll see it’s pretty cool… and when you get a taste of it! we let it take to the game.
Index
Kaggle “Titanic: Machine Learning from Disaster”
The first thing to do is to register on kaggle. for those who do not know Kaggle it is “The place to be” of Data Scientists. you will find a lot of more exciting competitions, tutorials, online training, forums. In short, it is a must if you are embarking on machine learning!
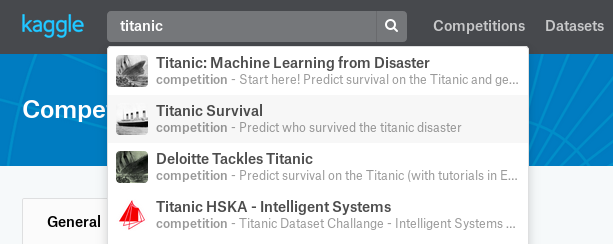
Once registered, select the ‘Competition’ tab and search for titanic. Select the first entry (“Titanic: Machine Learning from Disaster”) as in the screen below:

Now select the data tab and download the csv files. You have three:
- train.csv to train your model (this one contains the labels: Survived)
- test.csv to calculate the result from your model (this one does NOT contain the labels: Survived)
- gender_submission.csv : which shows you the expected result (format) by kaggle
That’s it, you’re ready to start your 1st Machine learning project (?)!
Model preparation
First of all we will work on the training game (train.csv). Here are the variables that we can start working on simply:
- Sex (Sex): data that are categorical characteristics and have only two values (male or female). We will digitize this variable via get_dummies ( Cf. One-hot article )
- The Cabin: A priori the first letter of the cabin suggests the deck, it is an interesting element …
- Age : obviously a primordial element. Do we not say “women and children first?” But be careful, because this variable is not always filled in. I therefore propose as a first step to replace the null values (NaN) by the average age of the other passengers.
- Boarding (Embarked)
- The price of the ticket (Fare)
- The class (Class): it seems that all the passengers were not accommodated in the same boat!
- Number of husbands / wives (SibSp)
In order to properly prepare the model and above all to be able to reuse the preparations made on the training set, I recommend doing a global preparation function.
import pandas as pd
from sklearn.ensemble import RandomForestClassifier
from sklearn.preprocessing import MinMaxScaler

train = pd.read_csv("./data/train.csv")
test = pd.read_csv("./data/test.csv")

def dataprep(data):
    sexe = pd.get_dummies(data['Sex'], prefix='sex')
    cabin = pd.get_dummies(data['Cabin'].fillna('X').str[0], prefix='Cabin')
    # Age
    age = data['Age'].fillna(data['Age'].mean())
    emb = pd.get_dummies(data['Embarked'], prefix='emb')
    # Prix du billet / Attention une donnée de test n'a pas de Prix !
    faresc = pd.DataFrame(MinMaxScaler().fit_transform(data[['Fare']].fillna(0)), columns = ['Prix'])
    # Classe
    pc = pd.DataFrame(MinMaxScaler().fit_transform(data[['Pclass']]), columns = ['Classe'])

    dp = data[['SibSp']].join(pc).join(sexe).join(emb).join(faresc).join(cabin).join(age)
    return dp
At that moment something interesting is happening. A classic problem that must be managed otherwise nothing will work! In fact, the data on the categorical variable “Cabin” of the test set does not offer the same values as those of the training set. So the get_dummies function will not return the same values for the two datasets! In this case, we do not have any cabins starting with the letter T in our test set.
This is a real problem to which we are going to give a radical solution in this case: remove the Cabin_T column squarely!
Xtrain = dataprep(train)
# remove the Cabin with T value as this does not exist in the test dataset !
del Xtrain['Cabin_T']
Xtest = dataprep(test)
Train our Model
For this first test we will use a Random Forest algorithm. Let’s train it:
y = train.Survived
rf = RandomForestClassifier(n_estimators=100, random_state=0, max_features=2)
rf.fit(Xtrain, y)
p_tr = rf.predict(Xtrain)
print ("Score Train -- ", round(rf.score(Xtrain, y) *100,2), " %")
We get a score of 93.27% , which seems pretty decent , doesn’t it?
Now let’s apply our trained model to the test set:
p_test = rf.predict(Xtest)
Data formatting for Kaggle
Remember, Kaggle is waiting for the outcome of your prediction in a particular format. You must therefore format and write to a file in this format:
- Column 1: PassengerId
- Column 2: Survived (1 or 0)
The Pandas bookstore makes your life easier here:
result = pd.DataFrame(test['PassengerId'])
pred = pd.DataFrame(p_test, columns=['Survived'])
result = result.join(pred)
result.to_csv("./data/result.csv", columns=["PassengerId", "Survived"], index=False)
Now go to kaggle.com and submit your result by clicking Submit Predictions:

Then upload your result.csv file (file name doesn’t matter) and get a startup score of 0.75598 !
Now it’s up to you to rework the data to improve this score 🙂


