 by
by The world of Pandas does not stop expanding! With the new pandas_profiling library, automatic (and quite complete) data analysis is within everyone’s reach. Simple and quick to implement, I couldn’t miss this little gem of profiling.
Index
First profiling
Let’s start by installing the library with Python / pip:
$ pip install pandas_profiling
As one might suspect, this library uses DataFrame Pandas . We are therefore going to start again from the titanic data to see what it gives.
from pandas_profiling import ProfileReport
import pandas as pd
train = pd.read_csv('../datasources/titanic/train.csv')
Then we generate the profiling report. 2 lines of code are enough:
prof = ProfileReport(train)
prof.to_file(output_file='rapport.html')
A report.html file is then generated. This comprehensive report presents all the information you need to start working with data.
Description of the analyzed elements
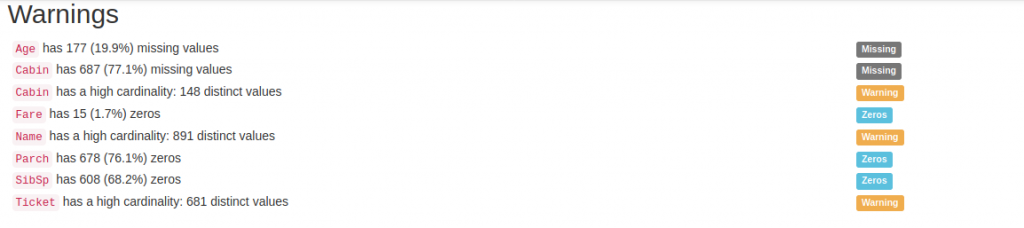
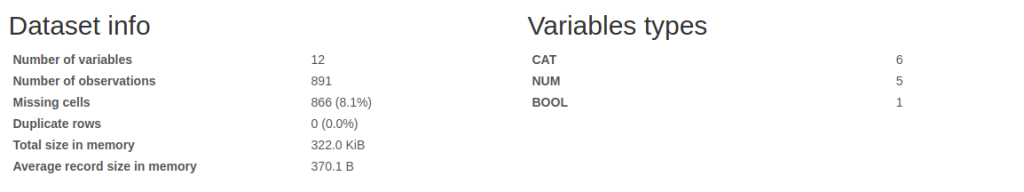
This is what the generated html page looks like:
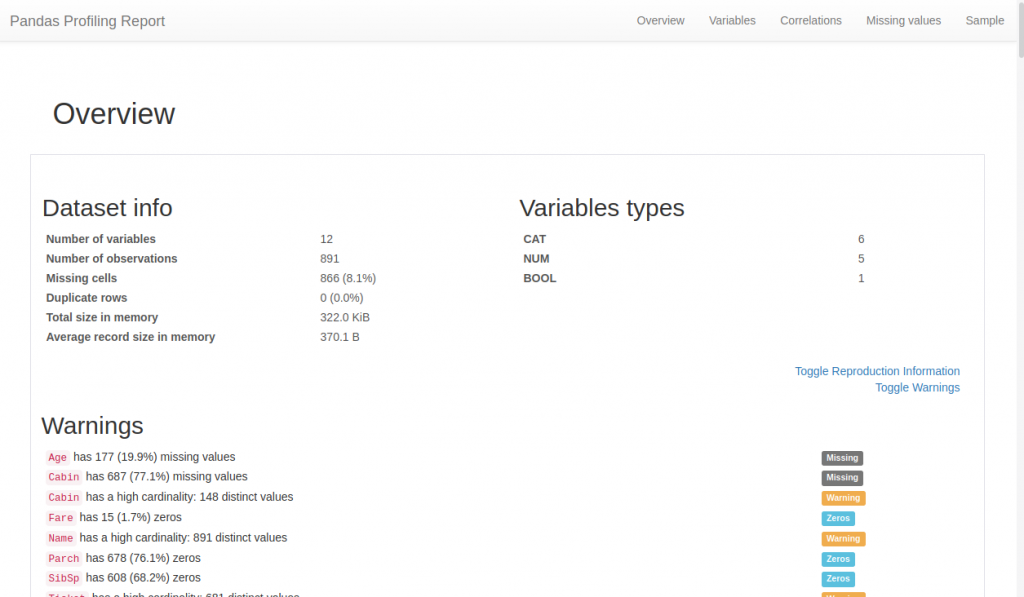
We find there, organized sequentially (or via the top menu):
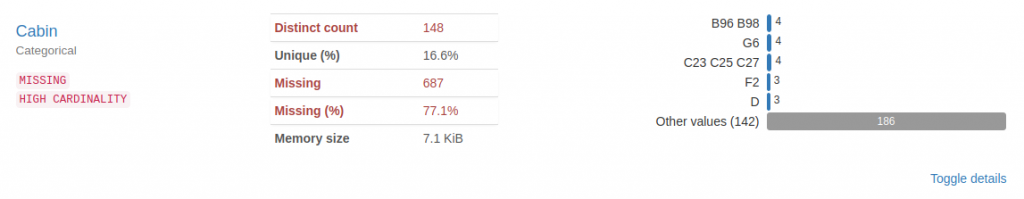
- A summary allowing at a glance to find the major concerns to be managed for a data scientist: missing data, cardinality, etc.
- Basic information like: The number of columns / rows, missing or duplicated data, occupied memory, etc.
By column:
- Quantile statistics: minimum value, Q1, median, Q3, maximum, range, interquartile range
- Descriptive statistics such as mean, median, standard deviation, sum, median absolute deviation, coefficient of variation, kurtosis, asymmetry
- Type inference: The actual data types found in the dataset ( categorical strings , numeric strings , etc.)
- The most frequent values
- Distribution of values (Histograms)
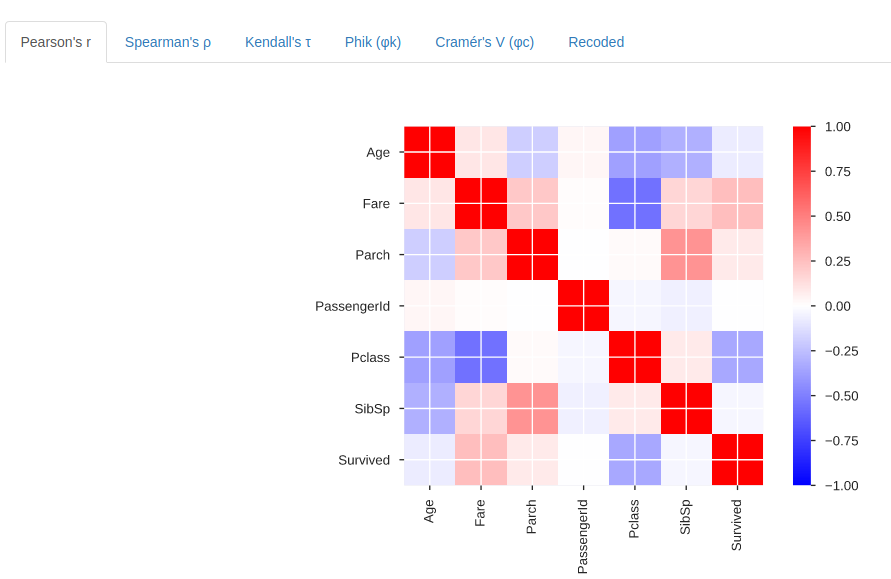
- A detailed analysis of correlations highlighting highly correlated variables, Spearman, Pearson and Kendall matrices:
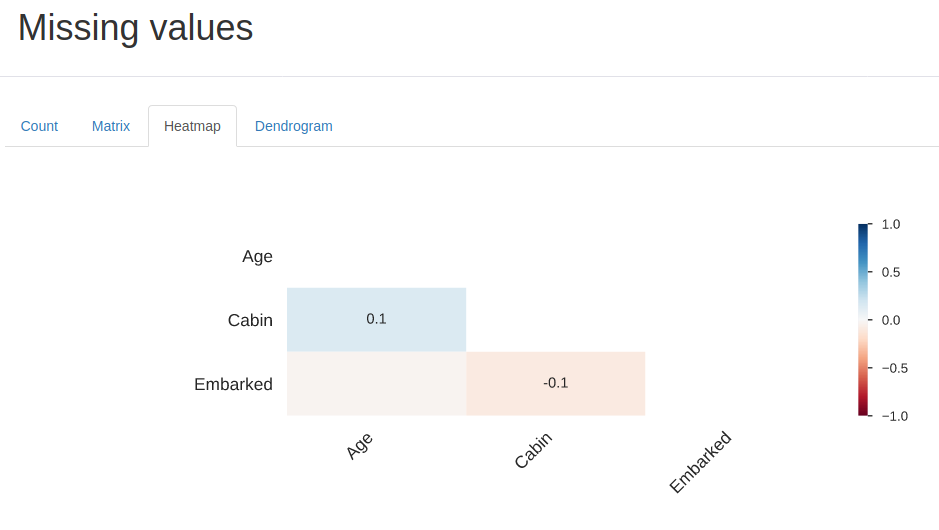
- Matrix of missing values, counting, heat map and dendrogram of missing values
- Text analysis informs you about categories (upper case, space), scripts (Latin, Cyrillic) and blocks (ASCII) of text data.
Let’s go a little further with the bookstore
For those who use Jupyter (like me) instead of generating a separate html file we can display the report in a notebook:
profile = ProfileReport(train, title='Analyse du fichier Titanic', html={'style':{'full_width':True}})
profile.to_notebook_iframe()
And if we wanted to process the result data in a script or another program, we can also retrieve the results of the analyzes in JSON format:
profile.to_json()
To save manually:
profile.to_file(output_file="titanic.html")
And for large data files, the analysis could take a very long time. You can then limit the analysis via the minimal option. Certain heavy treatments such as correlations will not be executed:
profile = ProfileReport(large_dataset, minimal=True)
Conclusion
You now know how to do advanced profiling on a dataset without any effort (well ok just 2 lines of Python). Be careful because as I said just before the treatments underlying this profiling can be very heavy … beware of the big Dataframe so otherwise you will have to arm yourself with a patient.
Find the elements of this article in Github.