
 by
by DataExplore is a small open source utility that allows you to view and even manipulate your data. Of course, we are quite far from professional and sharp tools like Trifacta, Altyrix, or others, but this little utility can be very practical… as long as we know how to use it correctly. It is indeed DataExplore is a powerful solution but its mastery requires a little practice in order not to get tangled up in the brushes. Welcome to a world where free doesn’t mean doing nothing.
In fact, and not to be disturbed by the ergonomics of this tool, let’s just say it in order to keep it in mind: this tool is a tool for developers which is in a way the graphical interface of a Pandas Dataframe!
In this this article we will see how to use this tool in these basic features.
Index
Installation
To install DataExplore, first you have to download it from the site: https://dmnfarrell.github.io/pandastable/
Then follow the instructions. Depending on whether you are on Windows or Linux (several distributions are supported), everything is explained there: https://snapcraft.io/dataexplore
For example on Ubuntu, all the instructions are here (in a few lines): https://snapcraft.io/install/dataexplore/ubuntu
Discovering DataExplore
Launch the application once installed you should have this screen:

The application is broken down into 3 parts.
- On the left you have the data presented in the form of a spreadsheet
- At the top right you have the data visualization part (dataviz)
- At the bottom right you have the rendering configuration
What may seem disturbing and this is the principle of this tool is that you will have to select the data in the spreadsheet part. These data will be displayed in the pane at the top right. Be careful because the selection / deselection is fast, even more delicate the order with which you will select the data is important and can completely change the visual rendering.
First manipulations
Regarding the data set, I suggest that you take those I recovered from Covid-19 (Cf. previous article ).
In the File menu select Import csv.
Ensuite sélectionnez le fichier que vous voulez analyser. Dans notre cas nous prendrons le fichier covid-19 France que j’ai mis dans github : https://github.com/datacorner/python_tutos/blob/master/covid19/data/latest.csv
Suivez et validez toutes les étapes par défaut, à la fin de l’import l’écran suivant doit être proposé (ci-dessous), validez en cliquant sur Import:
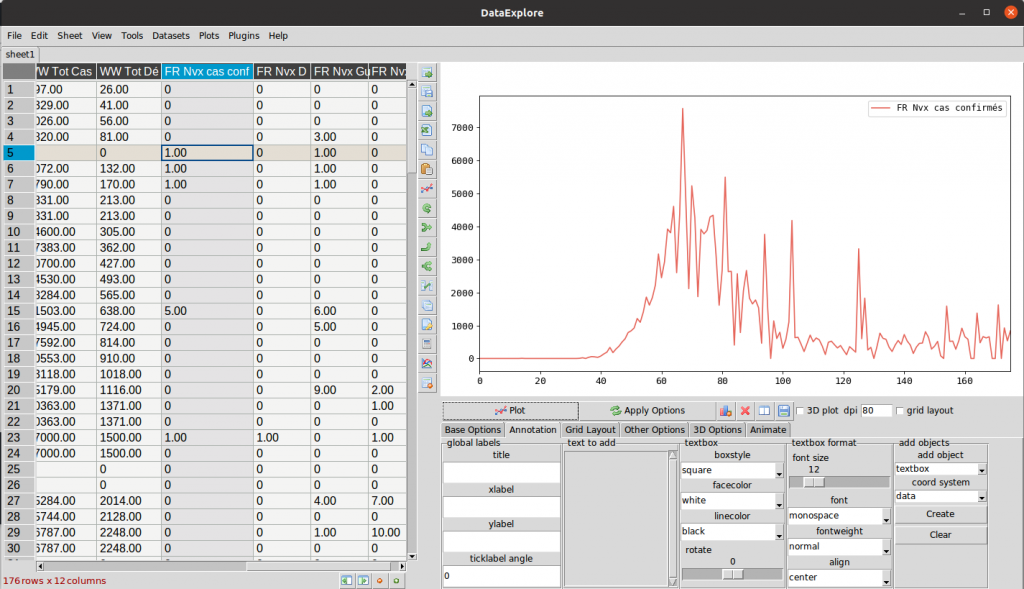
Now click on a header of a data column in the spreadsheet (on the left). then click on the plot button (middle right pane). DataExplore will display the curve of the data you selected in the top right pane. In the example below I clicked on the column “ FR nvx cas conf ” (highlighted in blue):
Go further …
Ok, en trois clics nous avons eu un graphique intéressant. Mais l’axe des abscisses semble être basé sur des index, et on aimerait plutôt avoir les dates auxquelles les mesures ont été faites non ? Cliquons donc sur l’onglet « Base Options » dans le volet en bas à droite. Désélectionnons ensuite l’option par défaut « use index » qui créé un index automatique et incrémental pour chaque mesure (ligne).
Si on re-clique sur le bouton plot une erreur « Not enough Data … » apparaît. C’est tout à fait normal car maintenant DataExplore attend deux jeux de données (soit deux colonnes). Il faut donc sélectionner dans l’ordre :
- L’entête de la colonne « Date » en premier (c’est important de respecter l’ordre)
- Puis l’entête de la colonne « FR nvx cas conf » en second
Cliquez ensuite sur le bouton Plot :
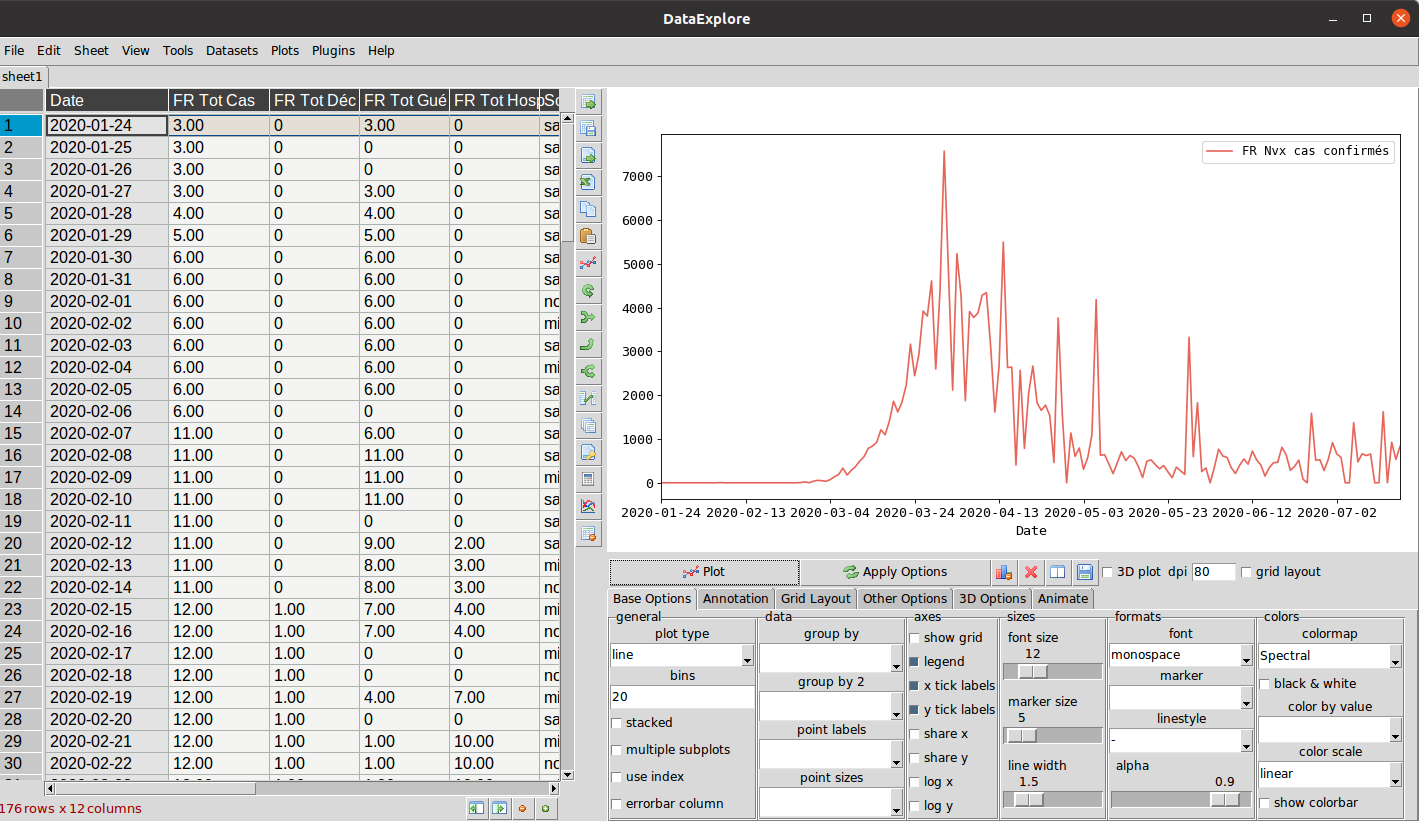
From now on, the two visualization axes take into account the two chosen data vectors!
Add another graph?
Want to add (stack) another vector of data (still from the same dataset)? nothing’s easier:
- Keeping the Control [CTRL] key pressed to make a multiple selection, redo the same previous selection.
- Keep the [CTRL] key pressed and select other column headers (for example the last 4 columns of the dataset …
- Click on Plot:
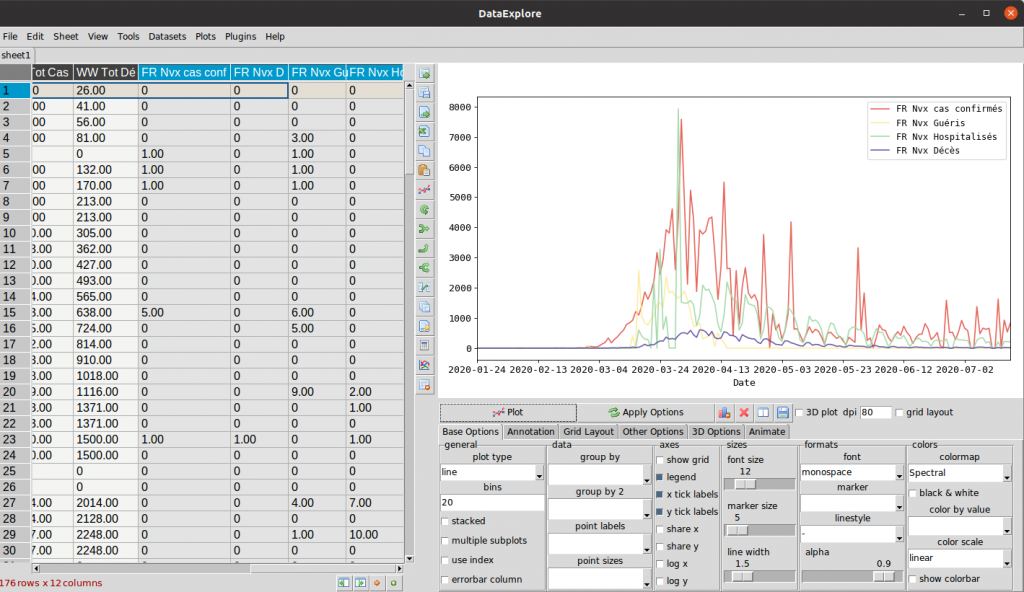
The visualization graph then automatically adds the vectors in the viz as above.
Other options?
Of course, the tool has multiple viewing options:
- ” Plot type ” allows you to change the display mode: bar graph, line, points, etc.
- ” Group type ” is used to manage data groupings up to 2 levels
- ” Show grid ” displays the grid
- ” Legend ” displays the legend
- You can specify a title and many other annotations in the ” Annotation ” tab
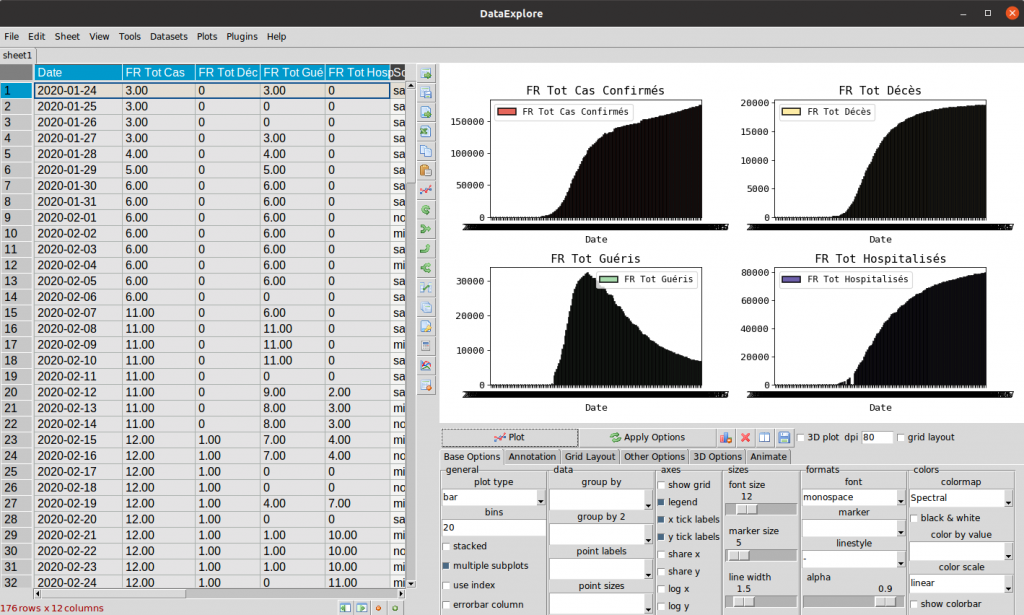
You want to have several viz but not in a superimposed way? no problem :
- In the “base options” tab choose ” multiple subplots ”
- Then select (as before 4 vectors via 4 column headers)
- Click on Plot …
Conclusion
We have seen in this post the simple manipulations of this tool.
DataExplore is a really interesting tool, as I said in the introduction, but which requires some practice in its use. If you tried to use it you realized that the tool quickly loses the selection of a column (because of an unfortunate click) and suddenly sometimes we can mix the brushes… Apart from these few problems handling, it is a tool that can be very practical.
To conclude this first part, I find that it is a tool to try (especially since it will only cost you time)! Moreover, if you are not convinced you can also wait for the second part of this article in which I will deal in particular with its capabilities to handle several datasets, perform filtering, functions, etc.