 by
by Index
Vélib Metropole
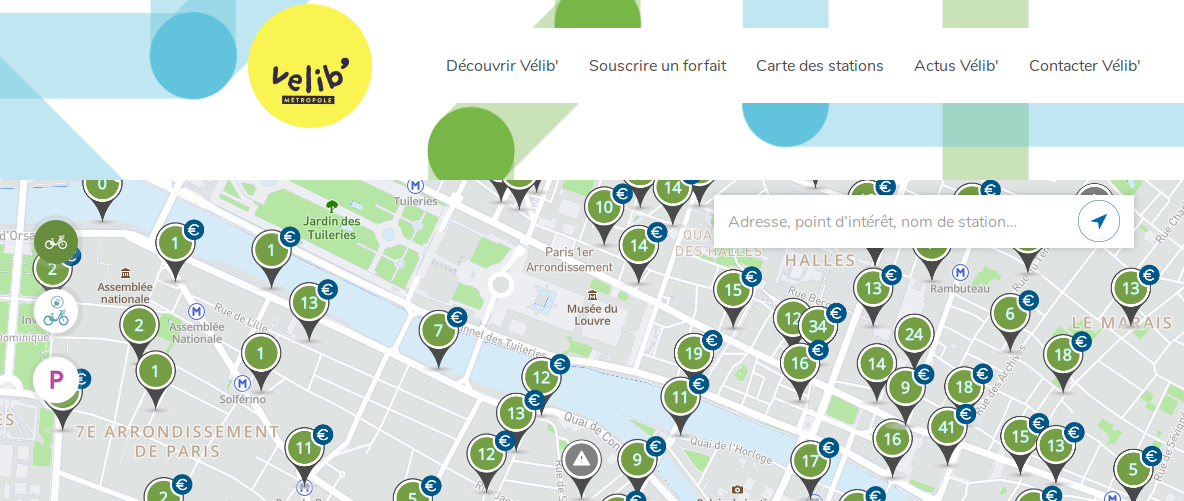
The Vélib Metropole service allows on-demand bicycle rental in Paris and its inner suburbs. Good news, Paris and its Open Data provides an access service (API) to the availability of bicycles in the stations. Never mind, what if we analyze these data more closely?

Les données de l’API
API data
The data can be accessed via the Open Database License (ODbL). By accessing the API site, we will be able to easily retrieve several information:
- Number of terminals available
- Number of bikes in PARK +
- Number of stations in station
- Number of mechanical bikes
- Electric bike number
- Station name
- State of stations
- etc.
Important thing: the API is accessible via REST / GET and returns data in JSON format.
In order to test the API I suggest you use the OpendataSoft portal which allows you to interact with it more easily. Otherwise you can type this URL directly into your browser and see the result:
https://data.opendatasoft.com/api/records/1.0/search/?dataset=velib-disponibilite-en-temps-reel%40parisdata&facet=overflowactivation&facet=creditcard&facet=kioskstate&facet=station_state
On the other hand we have a problem… no time stamp is planned! this is a real-time interrogation of the stations!
Query the API every hour
We don’t have a timestamp! Never mind, we’ll create it. For that we will create a program (here in Python) which will query this API every hour. We will collect the data at regular intervals and we will store the results in a flat file for subsequent analysis.
To regularly call a Python function we will not do a “wait” but we will use its multi-threading possibilities via the threading module and its Timer function. Here is the principle of use:
from threading import Timer

def update():
    getData()
    set_timer()

def set_timer():
    Timer(durationinsec, update).start()

def main():
    update()

main()
The REST API call is just as simple and for that we will use the request module. The call is made via 2 lines of codes, and then we will only have to check the return code (200) to know if the call was made correctly.
The data is retrieved in JSON format, but the good news is that the tree is very simple and we just need to scan the “record” nodes to retrieve the stations one by one.
Here is the complete Python code (also accessible via Github):
from threading import Timer
import requests
import pandas as pd
from time import localtime, strftime

def update():
    getData()
    set_timer()

def set_timer():
    Timer(durationinsec, update).start()

def main():
    update()

def getData():
    global iteration
    nbrows = 1500
    url = "https://opendata.paris.fr/api/records/1.0/search/?dataset=velib-disponibilite-en-temps-reel%40parisdata&rows=" + str(nbrows) + "&facet=overflowactivation&facet=creditcard&facet=kioskstate&facet=station_state"
    mytime = strftime("%Y-%m-%d %H:%M:%S", localtime())

    resp = requests.get(url)
    if resp.status_code != 200:
        print(mytime, " - ", iteration, " - Erreur dans la récupération des données")
    else:
        data = resp.json()
        dff = pd.DataFrame(columns =['Timer', 'ID', 'Station', 'Code Station', 'Type de stations', 'Etat de la station',
                                     'Nb bornes disponibles', 'Nombres de bornes en station', 'Nombre vélo en PARK+',
                                     'Nb vélo mécanique', 'Nb vélo électrique',
                                     'geo'])
        for rec in data['records']:
            dff.loc[len(dff)] = [mytime,
                                 rec['recordid'],
                                 rec['fields']['station_name'],
                                 rec['fields']['station_code'],
                                 rec['fields']['station_type'],
                                 rec['fields']['station_state'],
                                 rec['fields']['nbfreeedock'],
                                 rec['fields']['nbedock'],
                                 rec['fields']['nbbikeoverflow'],
                                 rec['fields']['nbbike'],
                                 rec['fields']['nbebike'],
                                 rec['fields']['geo']]
        if int(data['nhits']) > 0:
            with open("vélib_batch_parheure.csv", 'a') as f:
                dff.to_csv(f, header=True, index=False)
            print(mytime, " - ", iteration, " - Fin de la récupération, Nb de lignes récupérées: ", data['nhits'])
        else:
            print(mytime, " - ", iteration, " - Pas de données à récupérer.")
    iteration = iteration + 1

durationinsec = 1*60*60
iteration = 1
main()
It only remains to run the above script for several days and then recover the file vélib_batch_parheure.csvto analyze its contents.
Let’s analyze the result
We are going to use Tableau on the CSV file just generated. a certain amount of data preparation will still be necessary:
- Retrieving latitude and longitude from data in [X, Y] format. For that we will use the graphical assistant (data tab) to retrieve the coordinates.
- We will add KPIs such as the availability ratio ([Nb available terminals] / [Number of terminals in station])
Then a dashboard can, for example, present the problems of availability of bicycles by station and by hour as below:
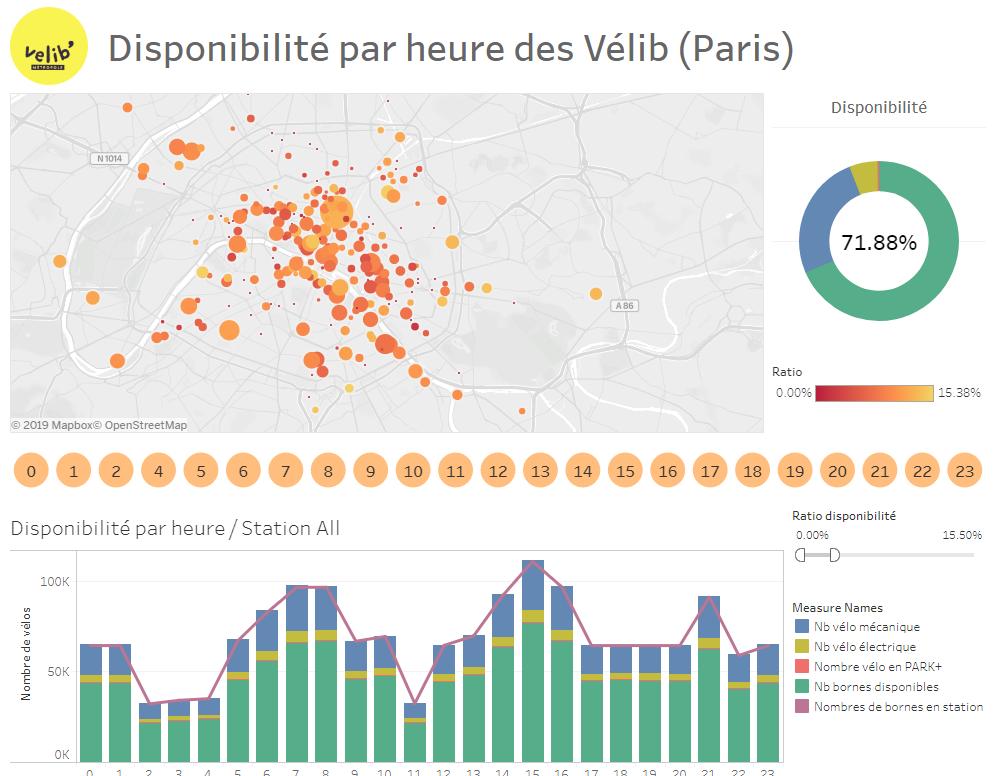
This dashboard is available and downloadable in Tableau Audience here .