
 by
by Index
What is Profiling?
Before getting to the heart of the matter, we must clarify what profiling is. Let’s look at the Wikipedia definition: “ Profiling is the process of collecting data from the various existing data sources ( databases , files, etc.) and collecting statistics and information on this data. »Ouch! Let’s just say that profiling is the analysis of data from the data itself.
In short, the idea is simple: you have data – about which you know little or nothing – and you want to make it speak at least from a content point of view. Of course you have (or not for that matter) a good documentation on the subject. But is it up to date? not sure ! anyway no question of trusting it, it is probably obsolete.
You will therefore have to audit your data! and the first step of this audit is profiling.
But what will profiling do? and scan all the data well without any prior structure (ie without relying on the documented data structures). Indeed no question of targeting already known problems, that would be too easy! No, profiling must be without preconceived ideas.
Profiling is an objective inventory of your data as it really is in your systems.
So no question of doing SQL! you do not have to configure anything in this step it is an approach which forces you to keep your objectivity on this step. You must therefore equip yourself, and this is what I will do in the second part of this article using Informatica Data Quality 10.2
Well let’s profile our data
And let’s profile them on a dataset on a file containing physical persons. We do this by launching Informatica Analyst (the Informatica Data Quality web client tool) to initiate profiling.
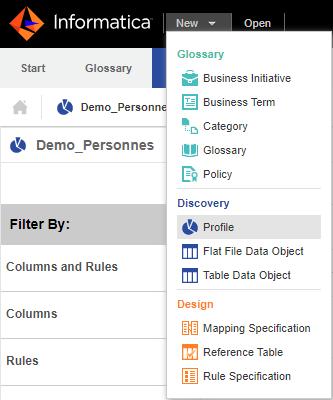
After choosing the New> Profile> option
You can choose the data source to analyze (profiler):
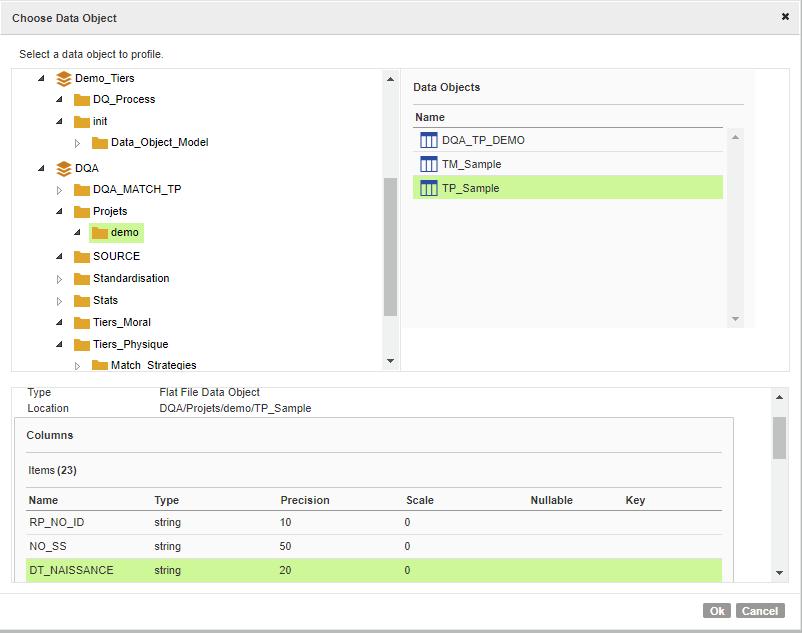
Follow the instructions and with a few mouse clicks your file will be analyzed.
Let’s analyze the results
Overall result
The result is immediate and is displayed directly in the Analyst, here is the summary screen provided:
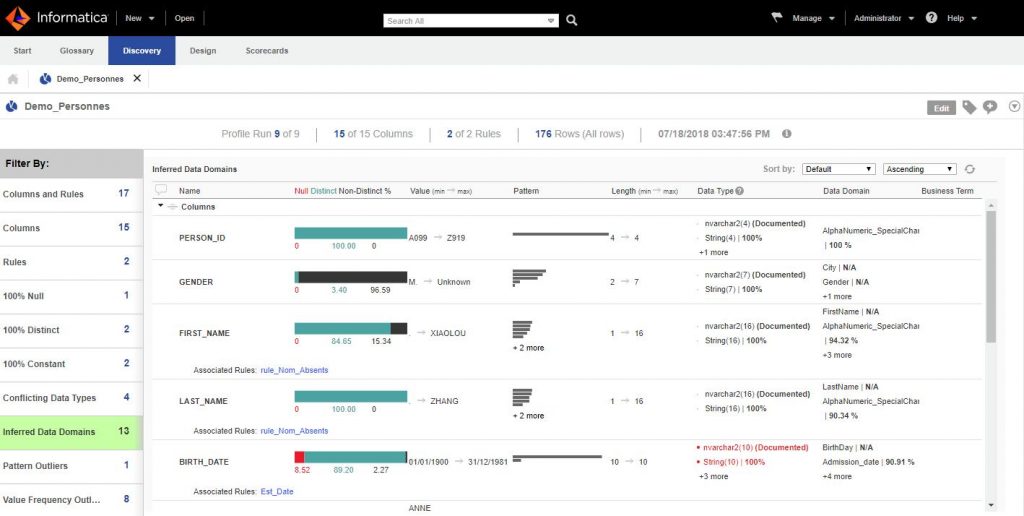
The left frame proposes to see the fields filtered by:
- Columns and Rules : to see all the fields
- Columns ; only the columns
- Rules : Only rules applied to data. The solution allows you to create rules that will combine the data from the dataset to present composite results.
- “100% Null” : Only unspecified columns
- “100% Distinct” : only the columns which have only distinct values
- “100% Constant” : only the columns which have constant values
- Conflicting Data Types : only columns whose typing analysis result does not match the documented one.
- Inferred DataDomains : Columns for which Informatica Data Quality was able to determine more relevant data types (e.g. email detection, phone number, etc.)
- Pattern / Freq. outliers ; In the world of statistics or Machine learning, outliers are the values that stand out. for example, they may be values that “disturb a Gaussian distribution. In short, these may be values that should not be taken into account. Informatica Data quality automatically detects these values against a pattern or through their distribution frequency.
The right frame allows him to visualize the columns / fields with information automatically collected / calculated by the tool:

- The percentage ;
- of null values (Red)
- of distinct values (Green)
- of non-distinct values (duplicates) (Black)
- The minimum and maximum values
- Distribution by pattern
- Length (min / max)
- The types of data observed
- Data domains (ie advanced types: example: mail, telephone number, etc.)
Some first conclusions at a glance:
- The BIRTH_DATE, DEATH_DATE, MOBILE_PHONE fields are not always filled in
- The email field only has 90% email in it
- The data is only French (NATIONNALITE always equal to FR)
- We have duplicate phone numbers (3 in all)
- etc.
Result by column / field
Now this is an interactive screen, just click on the column to go into detail. Let’s zoom into the BIRTH_DATE column:
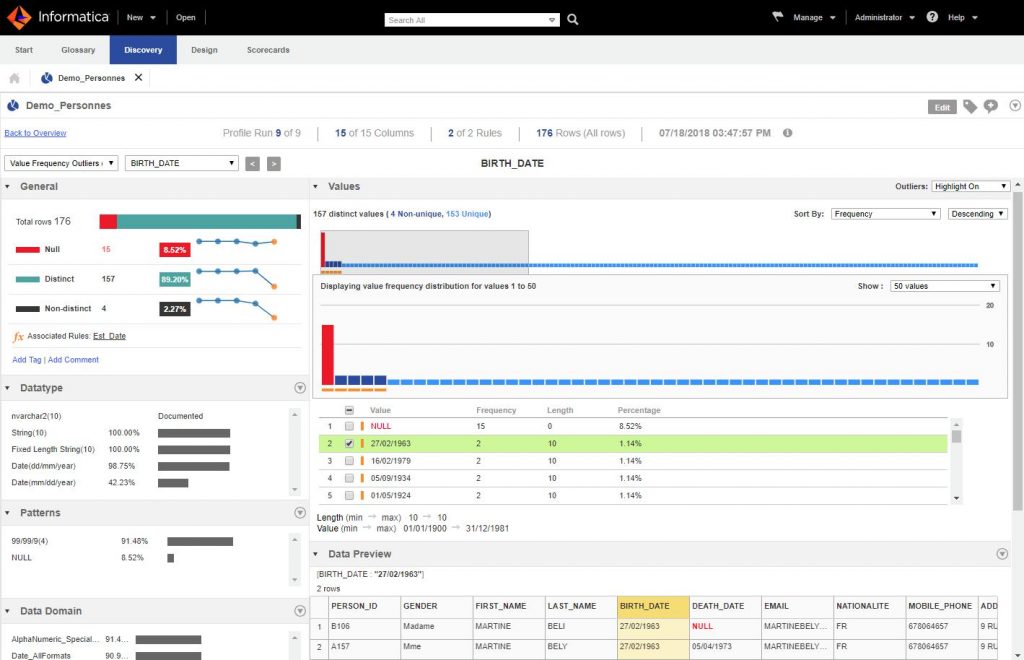
The screen is well supplied and is full of various information.
First of all, the panel on the left proposes for this column / field:
- The number of null values (completeness)
- The quantity distinct values
- The number of duplicate (non-distinct) values
But if you look closely, the screen even suggests their evolution over time for each of these indicators. Indeed, if you launch Profiling several times, you will be able to compare your results with the previous ones. Useful if you have streaming data for example!
Below you have several frames:
- Datatypes : which offers the types of data found in this column
- Patterns : which shows you what are the patterns (the structure of the data itself)
- Data Domains : advanced data types (email, dates, telephone number, etc.)
In the Value frame on the right you have a graph that shows you the distribution of values for that column. Outiers (non-standard values) are marked with an orange square. You can walk around this graph but also and above all consult the values and drill down at any time on such or such value (s). Besides, you can drill down on any type of observation (on patterns, datatypes, etc.).
For example, we see here that the values are almost all distinct… except for 4 duplicate dates! wish it might be interesting to see what is behind these dates. If we drill down on the date 02/27/1963 (Cf. screen above) we check with a few clicks that a duplicate is hidden behind (Mme Beli vs Mme Bely).
Follow-up and conclusion
Of course, profiling and data analysis does not stop here. In fact, it is rather the opposite: it is only the essential starting point of a good data analysis. The advantage of this first step is that it does not produce any effort… for the user, it is enough to be guided and to see the results.
The next step will undoubtedly require a little more effort because very often:
- You will need to create and apply business rules.
- It will also be necessary to cross-reference data from several different (heterogeneous) sources. Again you will need a tool that allows you to do this easily.
Fortunately, some tools such as Informatica Data Quality provide you with a rule editor and allow you to directly apply these rules in the analysis we have just seen. It also offers the possibility of crossing cross-datasource information, which will very quickly prove to be essential. But these possibilities are not part of this article so I suggest you review it in another post.
To conclude, profiling is an essential first step in any data project. It is all the more an asset as it will provide you with a great deal of information effortlessly and in a completely objective manner!