 by
by As part of the development of my framework ( JOY ), it seems essential to me to go quite far in terms of restitution. This is rather good because HTML version 5 coupled with javascript now allows this type of functionality to be offered, and this in a rather attractive way. No more flashes and other too heavy tools. Of course, if we do some research we will find everything, from free to paid, through more or less packaged bookstores. This article reviews some of these libraries.
Index
Several bookstores, one choice?
Before launching into my library bench, what are my criteria:
- Ease of use
- Free & autonomy (I consider that my framework must be independent and not reference libraries on another server).
- Lightness
- Responsive mode supported (for mobile apps)
- Diversity of graphs offered (bar, line, radar, polar, gauge, etc.)
- Graphic quality & basic ergonomics (dynamic aspect of graphs, scales, etc.)
This will allow me to filter a lot of bookstores right now. There are also quite a few pages on the internet that offer reviews of these types of bookstores. Overall we will always fall back on the same ones: C3; D3; Raphael, Dracula, Chart.js, etc.
What does not make the choice easy is really the coverage of each of these solutions which is not the same as its competitor. The choice is therefore difficult. Personally and after having tried them I hesitated a lot between D3 and chart.js but I admit that my heart has swung towards chart.js which for me best respects the criteria that I previously listed. Now I find that the gauge is missing for example but hey it’s not very serious I will overcome it in another way.
So i’ve made my choice: I’m going to use chart.js (MIT License) which combines 6 charts, a responsive mode and many other features.
chart.js
After downloading the javascript library (only one file) on the site I recommend going directly to the documentation page which is not only very synthetic but above all very well done to use the solution very quickly. Moreover, once the Zip has been downloaded, it contains not only basic examples of use but also quite a few examples of further use (with progress bars, scales, etc.).
Another significant advantage is that the data that will be the fuel of our graphics is natively in json format. This will allow me to provide services through my framework which will “connect” directly and naturally to the API of chart.js
What does it give ?
So I created a joy-chart.js file that will offer prebuilt functions to display graphs. In this file I would have for example to display a bar chart:
function displayBar(canvasID, title, content) {
var ctx = document.getElementById(canvasID).getContext("2d");
myChart = new Chart(ctx, {
type: 'bar',
data: content,
options: {
elements: {  rectangle: { borderWidth: 2, borderSkipped: 'bottom' } },
responsive: true,
legend: { position: 'bottom' },
title: { display: true, text: title }
}
});
return myChart;
}
The graphics are displayed in
displayBar('div_graph1', 'Global scoring by Glossary', content);
div_graph1 is the id of a CANVAS tag:
<pre class="wp-block-syntaxhighlighter-code"><pre class="wp-block-syntaxhighlighter-code"><canvas id="div_graph1" /></pre></pre>
Rendering is pretty good for so few lines of code, isn’t it?
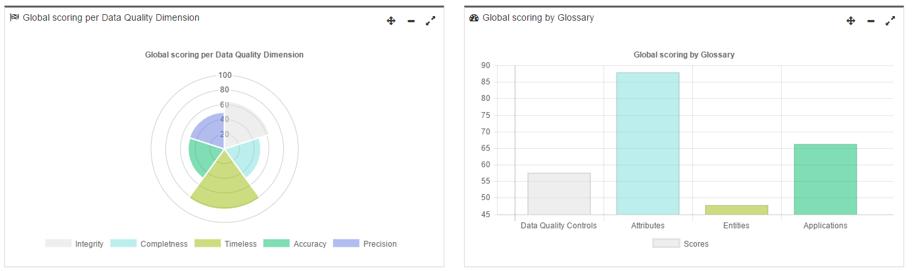
You noticed I also put a polar type graph.
Here is the call function:
function displayChartPolar(canvasID, title, content) {
var ctx = document.getElementById(canvasID).getContext("2d");
var config = {
data: content,
options: {
responsive: true,
legend: { position: 'bottom' },
title: { display: true, text: title },
scale: {
ticks: { beginAtZero: true },
reverse: false
},
animateRotate:true,
segmentShowStroke : true,
scaleShowLine : true
}
};
return Chart.PolarArea(ctx, config);
}
The code is slightly more complex, but hardly In the same way we will create functions to display radars, line graphs, bubbles, etc.
Upload the file to Github